4. Multiple Genes View
Analyze the expression levels of a group of genes within a dataset
4.1. Scope
- Use R2 to investigate the expression levels of more than 1 gene within a specific dataset.
- In this example the expression levels of small groups of genes listed from several pathways will be used showing which genes are differentially expressed per subgroup.
- Adjust several parameters in the settings panel
- In R2, the samples are annotated with e.g. clinical data. Each group of annotated data is called a “Track” in R2. These tracks can be used to split the group gene expression levels per track.
4.2. Step 1: Viewing multiple genes
Use “single dataset” in field 1 and select the “Tumor Medulloblastoma PLoS One - Kool - 62 - MAS5.0 - u133p2” dataset in field 2.
Choose “View multiple genes “ in field 3 and Click Next
To illustrate the possibilities of the multiple gene view, genes identified as classifiers for Medulloblastoma subtypes (Kool et al, Plos one) will be used. In the GENE/reporter textbox type or copy the following genes: AXIN2,BOC,dkk2,GABRA5,PTCH1,SMARCD3,WIF1 and click next.
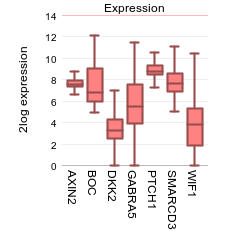
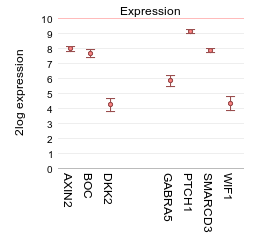
Under the graph many settings can be adjusted in the Adjustable settings box. For instance, you can choose a different type of graph. Next to the option to influence the space between the genes, the height of the plot etc, you can add one or more extra spaces between genes of choice by adding one or more extra delimiters. In the GENE/reporter textbox add 2 extra comma’s behind dkk2 (AXIN2,BOC,dkk2,,,GABRA5,PTCH1,SMARCD3,WIF1); in the field ‘Plot type’ select “Average with stderr”, set ‘Transform’ to and click next. This enables the creation of visual subgroups in the gene representation.

4.3. Step 2: Viewing multiple genes through track annotation
In Figure 1 a selection of gene expression profiles is depicted in one picture in contrast to the one gene view. Figure 2 shows the possibility to make gene subgroups by adding extra spacers to the plot.Now we will look at the option to represent the gene expression separately for each subgroup of a categorical track. In this manner potential relations between subgroups and gene expression can be visualized.
The dataset we are using is described in PLoS One.”2008 Aug 28;3(8), Kool M et al. Here the classification of 5 medulloblastoma subgroups are reported and annotated as such: A,B,C,D and E. To investigate the expression levels of a small group of genes per subgroup of the categorical track “subtypes” of medullablastoma cells, select in the Adjustable settings box “subtype (5 cat)” at ‘use track’, “lump by group plot gene” at ‘handle groups by’ and “Track” at ‘color by track’. Further set ‘Transform’ to “none”, select “boxplot” at ‘Plot type’ and click NEXT.
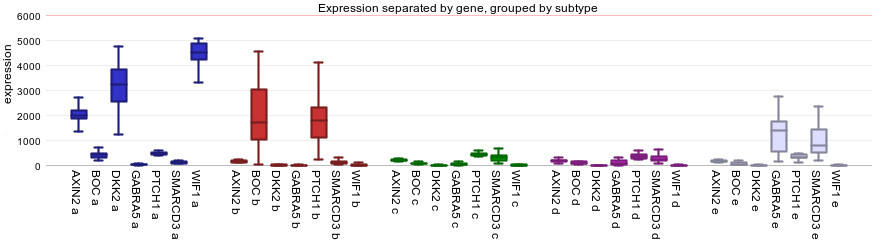
Most of the overexpressed genes are part of the WNT (subgroup A) and de SHH (subgroup B) signaling pathway as shown by Kool et al.In Figure 3, the gene names and the subtype labels a,b,c,d and e are concatenated on the x-axis. The Medulloblastoma molecular subtypes clearly show different expression profiles, with an overexpression of genes in subgroup a and b.
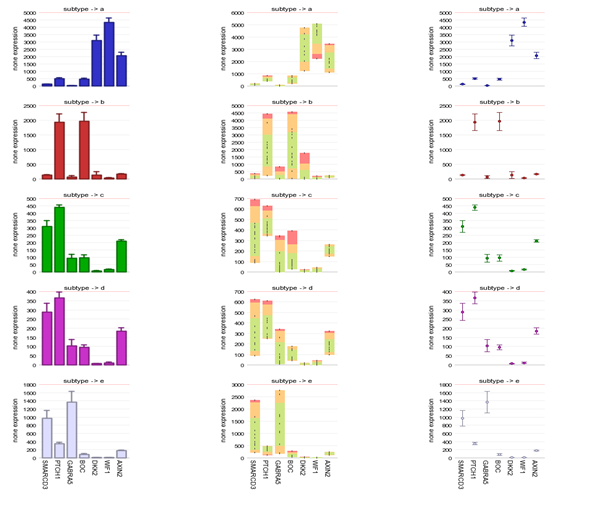
Also try the “lump by gene plot group” which will produce an image where the genes are shown, separated by the subtypes. The “group by panel” option under ‘handle groups by’ will display the same information in a multifaceted graph with separate panels for each sub-group of the chosen track.

The sample filter option allows the user to generate a multiple gene view per track.
4.4. Final remarks / future directions
Some of these functionalities have been developed recently. If you run into any quirks or annoyances don’t hesitate to contact r2 support (r2-support@amc.uva.nl).
We hope that this tutorial has been helpful,the R2 support team.