14. Using and Creating genesets in R2
Or how you can achieve clear, presentation ready heatmaps of your dataset
14.1. Scope
- In this tutorial the visualization of a set of genes will be explored
- R2 provides a conventional heatmap view””
- This heatmap view can be adapted to your needs by sorting the data along the axes according to your wishes.
- Generating your own genelists to analyze using the Toplister function.
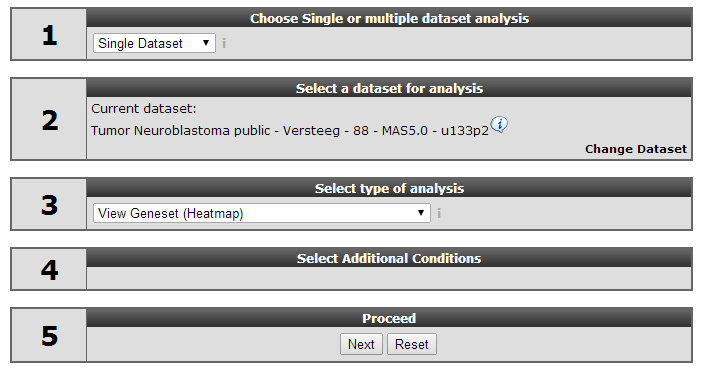
14.2. Step 1: Selecting data and modules; creating a Heatmap
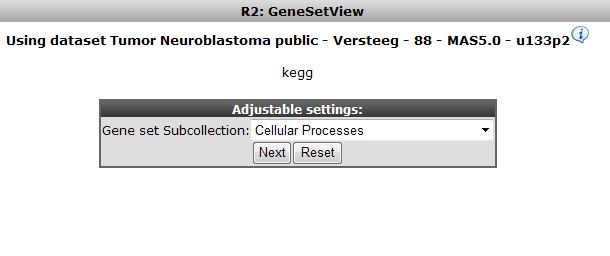
On the main page of R2 select View Geneset (Heatmap) (Figure 1). Click ‘Next’.
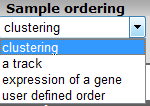
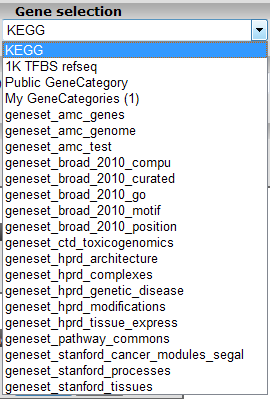
In the subsequent window three choices are available to customize the way the GeneSet data will be presented (Figure 2). The first field asks for a collection of genesets (Figure 3); R2 harbors hundreds of publicly available genesets, KEGG pathways being one of them. The second field is a filter for selecting the samples. The third field is the order by which the resulting heatmap will be drawn (Figure 4). By default R2 presents the data in a heatmap where a hierarchical clustering is performed on the genes, making use of the information present in all samples to order the data. We’ll show first what this ordering by clustering looks like. Keep all settings as they are and click next. The search fields below the Adjustable Settings dialog provide a shortcut for finding a GeneSet of choice, we’re going to use this now. Suppose we want to find a geneset containing Cell Cycle genes. Type Cell Cycle in the ‘Search a geneset’ box and click ‘Search’.
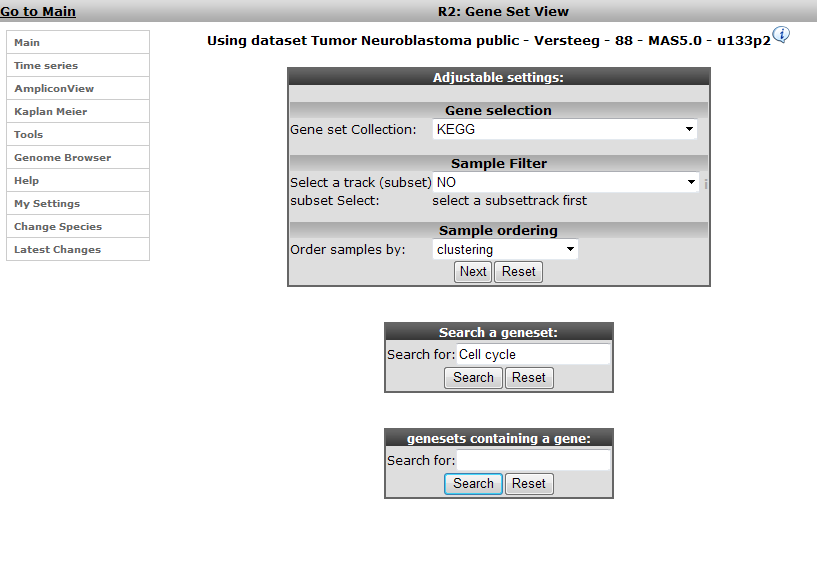

Figure 3: Available collections of Genesets in R2
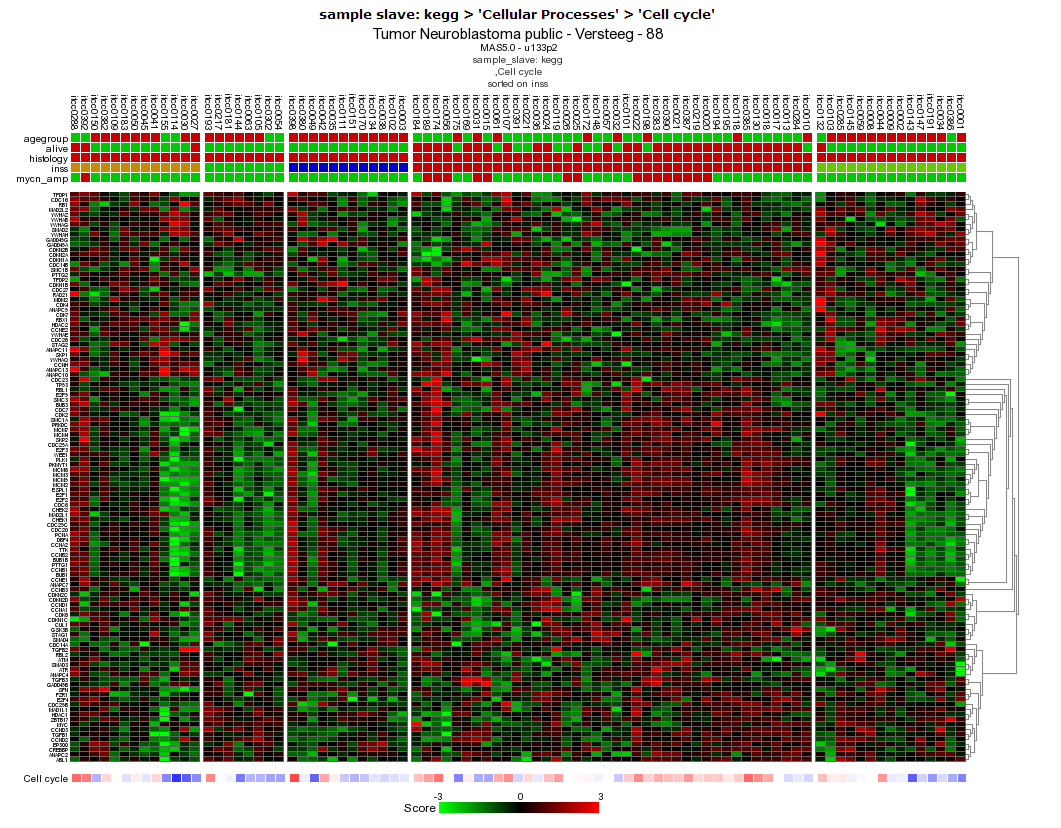
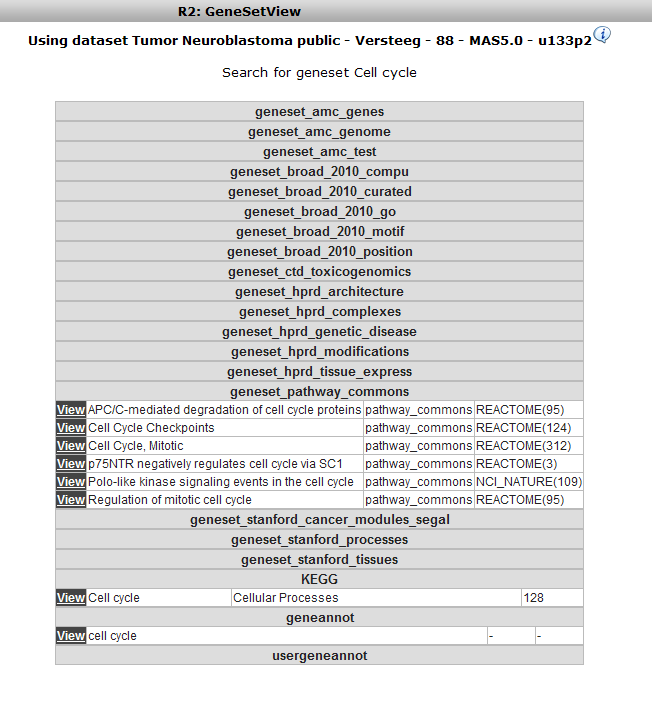
In the next window all genesets containing the words Cell Cycle in their description are shown. Choose the KEGG Cell Cycle (in the collection of Cellular Processes) by clicking the ‘View’ hyperlink.

The Affymetrix data for the Neuroblastoma 88 dataset is shown for the genes in the Cell Cycle as a clustered heatmap. Hovering over the heatmap rectangles reveals the sample information stored in the R2 database. Keep in mind that the hovering option is limited to 10000 cells otherwise the graph generation consumes too much time. This limitation can be adapted in the ‘User Options’ menu item.

14.3. Step 2: Using multiple GeneSets
R2 also allows for multiple genesets to be shown at once; return to the main page; select View Geneset (Figure 1: Select View a Geneset). We’re not going to search for a geneset but look for multiple sets at once in the KEGG collection. In the next window (Figure 2) leave the default collection to KEGG. Click “next” in the ‘Adjustable Settings’ box.
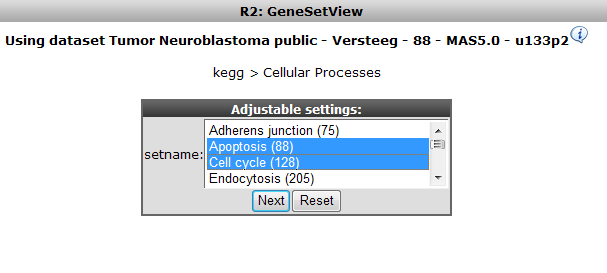
In the next screen a subcollection within the current collection of genesets has to be defined; Select ‘Cellular Processes’ and click “next” (Figure 7).

Figure 7: Selection a subcollection from the large collection of Kegg pathways
R2 allows selection of multiple genesets at the same time; CTRL+ select Cell Cycle and Apoptosis and click ‘Next’.

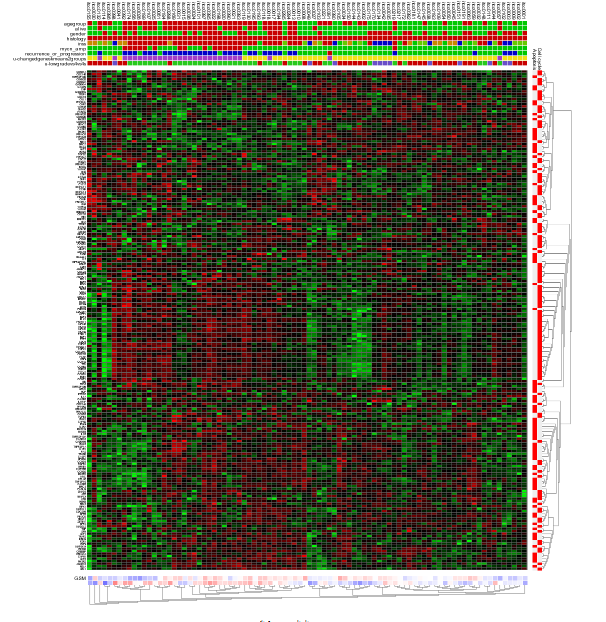
The resulting heatmap (Figure 9) has the samples ordered by the result of the clustering of the dataset. On the y-axis the genes are annotated with their membership to both pathways; the upper bar is the Cell Cycle. It is obvious that part of the Cell Cycle member genes are clustering together.

Figure9: Heatmap view of the Cell Cycle and Apoptosis genesets for theNeuroblastoma 88dataset.
14.4. Step 3: Relating genesets with data annotation
We’re going to explore that in further detail by sorting the dataset according to the staging. Return to the former choice page (Figure 2) by clicking the back button in your browser. Choose ‘Order samples by a track’ and click “next” (Figure 10). In the next subcollection selection window choose Cellular Processes again (Figure 7) and click “next”.
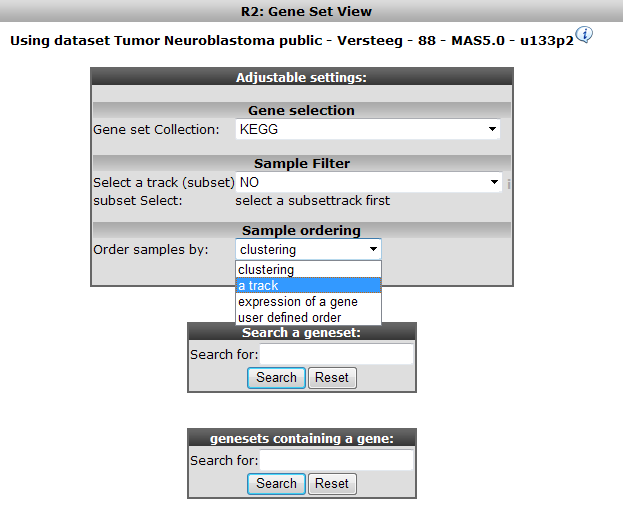
Figure 10: Selecting the domain to order samples by: Order by a track
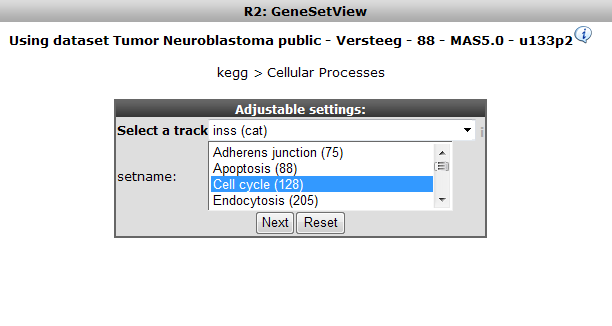
Now select only the Cell cycle subset as GeneSet. Choose the Neuroblastoma staging INSS as track to order samples by and click “next” (Figure 11)

Figure 11: Selecting Cell Cycle only, order samples by Neuroblastoma staging track
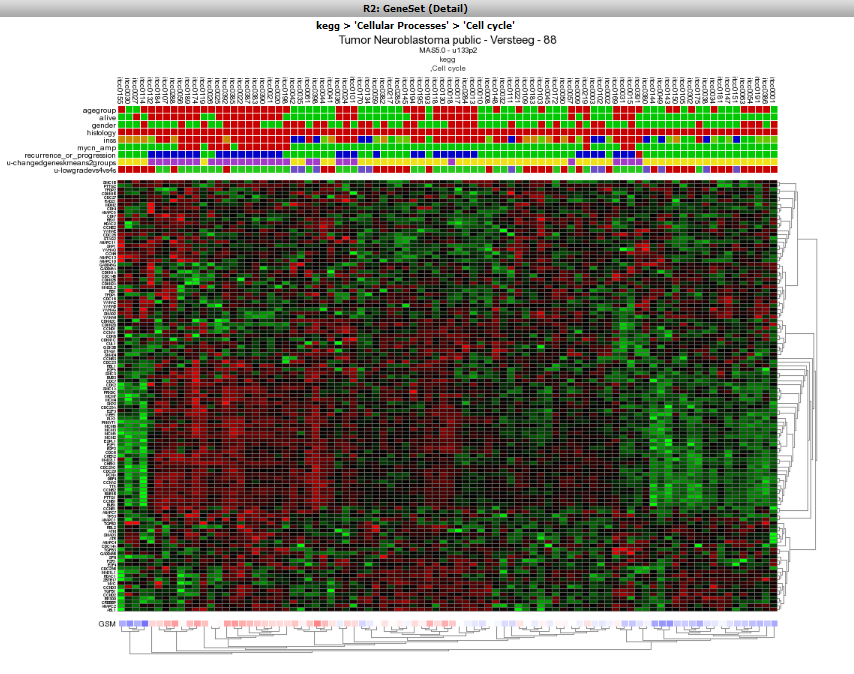
In the resulting heatmap it is clear that there is a segment of genes in the Cell Cycle pathway cluster that is consistently upregulated in the stage 4 Neuroblastoma samples (in red in the INSS track).
 Figure
12: Heatmap sorted by INSS stage, there is a clear relation between
the stage 4 tumors (in red in the INSS track) and up-regulation of a
subset of genes #:of the Cell
Cycle
Figure
12: Heatmap sorted by INSS stage, there is a clear relation between
the stage 4 tumors (in red in the INSS track) and up-regulation of a
subset of genes #:of the Cell
CycleIn the previous example R2 offers the possibility to set a fixed ordering of samples by track. It”s also possible to perform a clustering and set a fixed ordering of genes. In the “adjustable settings” panel, select user defined order in the geneselection pulldown menu and click next two times. Here you can paste a list of genes sorted according to your needs.
Ifyou want to perform hierarchical clustering with a fixed sample order. From the main menu select View a Geneset (Heatmap) , in the sample order section, select user defined order and click next, select a geneset sub collection and click next. Copy and paste your sample order and click next. The export track function see chapter Error: Reference source not found can be handy for this issue.
 Figure
12: Heatmap sorted by INSS stage, there is a clear relation between
the stage 4 tumors (in red in the INSS track) and up-regulation of a
subset of genes #:of the Cell
Cycle
Figure
12: Heatmap sorted by INSS stage, there is a clear relation between
the stage 4 tumors (in red in the INSS track) and up-regulation of a
subset of genes #:of the Cell
Cycle
14.5. Step 4: Unsupervised hierarchical clusterin with a geneset
It could be that for a given dataset there is no annotation to apply the analysis tools R2 is offering or your”re lacking a starting point to further investigated a dataset. A good starting point could be to do is to do a simple hierarchical clustering
- In chapter “Differential expression” is explained how to generate genesets describing the difference between tracks (groups) from an annotated dataset. Researchers often want to investigate the presence of subgroups without using annotation information in their dataset or just find a list of genes with the highest variation in gene expression. In case your dataset of interest lack annotation you are still able via the Toplister tool to investigate datasets for biological relevance.
- For this purpose R2 is hosting a convenient tool to generated lists of genes using a filter. By using this filter you can select groups of genes with the highest, lowest or most variable genes etc etc.
- To use the Toplister tool, either select ‘Toplister’ from the dropdwn menu in box 3 of the main page or go to the menu on the left and select tools> small tools > Toplister. Make sure Data Type is set to Expression data and select Tumor Medulloblastoma PLoS One - Kool - 62 - MAS5.0 - u133p2 and click next. In the adjustable settings screen all kinds of settings and filtering options can be adapted. We want to know which 100 genes have the highest variation in this case leave “ which set” at standard deviation (SD) which is the default settings. Click next.
- R2 has generated a list of 100 genes showing the highest variation in gene expression.
- Scrolling down to the bottom of the page shows possibilities to save or export the genelist to use for other analyses and/or usage in other datasets. Clicking on the Heatmap (Zscore) will perform an unsupervised hierarchical clustering and plots a heatmap . In this heatmap the subgroups are clearly clustered together as shown by Kool e.a. (2008).
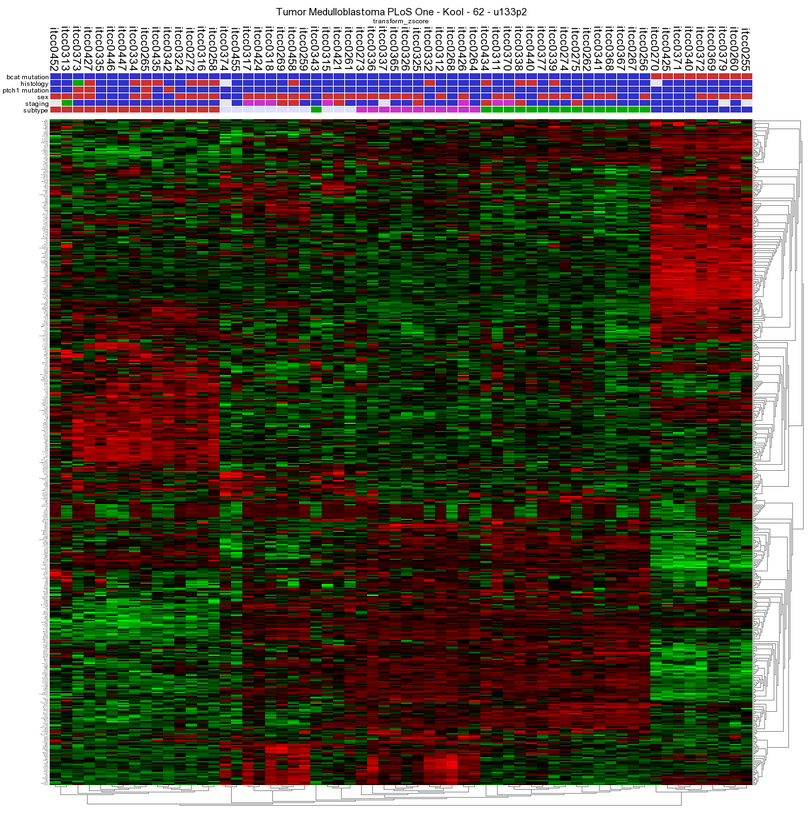
Figure13: Unsupervised hierarchical clustering revealing subgroups in a Medulloblastoma dataset.
14.6. Final remarks / future directions
Everything described in ths chapter can be performed in the R2: genomics analysis and visualization platform (http://r2platform.com / http://r2.amc.nl)
We hope that this tutorial has been helpful, the R2 support team.