24. R2 Dataset Addition
How to add your own or publicly available datasets for analysis in R2
24.1. Scope
- Learn how to add your own datasets to R2
- Have datasets added that are published in literature.
24.2. What to prepare when you would like to have a dataset added
R2 allows users / groups to have their own (private) human / mouse datasets added to the platform, which enable them to analyze their own data from anywhere in the world, as long as they have access to the internet. Such datasets can be added with various access policies, ranging from public to restricted to a single user. The current document describes all that you need to know about the addition of datasets in R2, and will also show you how files should be prepared.
24.3. Who can add datasets to R2
Most often, users would like to analyze their data, in combination with datasets already present in the R2 database. For example, one would like to compare the extend of expression, compared to other tissues (the so called MegaSampler). One can imagine that such analyses require identical processing for all datasets of the same platform (provided that the normalization scheme supports this). For that reason, we have decided that only administrators of the R2 platform can add new datasets, since they understand the R2 platform architecture and can supervise / guide the upload procedure.
24.4. Addition of a public dataset from the GEO database
Having a public dataset added to R2 from the NCBI GEO database is by far the easiest. Depending a bit on whether the array platform is already used within R2, such datasets can be added fairly quickly. In most cases you only have to send an email to r2-support@amc.uva.nl stating the GEO series identifier GSE***** and one of the administrators will take care of the rest. One note for your consideration though. Since the R2 platform has initially been designed to work with Affymetrix microarrays, it works best with single channel platforms. We do also incorporate dual channel datasets, but always warn for potentially unwanted behavior. For the addition of Affymetrix datasets, we preferably would like to be able to work with the raw data (CEL files), so please make sure that those are attached in the GEO series.
The GEO database can be browsed from http://www.ncbi.nlm.nih.gov/geo/browse/?view=series
24.5. Addition of personal datasets
Within R2, we also house datasets that are provided by authors which are not (yet) available in the public domain. In some cases these are made publicly available, but most often, some form of restricted access in enforced on them.
24.6. Access levels
R2 can provide access to datasets on a number of levels. The default access model provides public access to a dataset to anybody using R2. Within R2, datasets can also be made accessible to a group of users. Such a construction is ideal for departments where more people want to make use of the information. Also consortia can make use of this access model. Finally, datasets can also be made accessible to single users. In all of the cases where restricted access is involved, users should create a (free) personal account for R2, and be granted access by an R2 administrator. Requests for access to a group should be send by the owner of a group, or such an owner should at least be cc-ed in the email correspondence. Additional owners of a group or transfer of the ownership to another person can be done achieved by email to r2-support@amc.uva.nl from the current owner. If your research group already has data in R2, then you should already know the name of your user-group.
24.7. Preparing the expression data
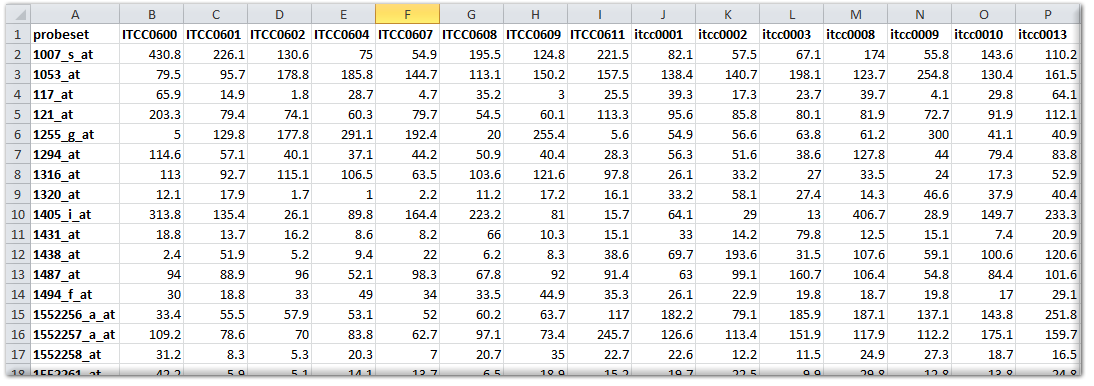
When the data to be uploaded originates from Affymetrix gene expression platforms, and you would like to have the data added in the standard way, then we prefer to have the original CEL files send to us by www.wetransfer.com or a similar service. We can then add the dataset in such a way that it can be used in conjunction with the publicly available datasets from the same platform and normalization scheme. If normalization schemes, other than the mainstream MAS5.0, RMA, gcRMA, or RMA-sketch are preferred, then you should perform the normalization yourself and send us the normalized data as a matrix (like a tab delimited export from an Excel sheet). A data matrix should be constructed in the following manner: the first row is considered to be the header and should preferably start with the following sign #H: for the 1^st^ column. The 1^st^ column should contain the reporter IDs of the platform (such as probe sets, in the case of Affymetrix). If you are not sure which column represents the reporters that can be used in R2, then please ask by email (Especially Illumina arrays contain a number of fields that look usable). The signal values (preferably non-transformed) of the samples can then be added in subsequent columns, where the 1^st^ row should contain the sample identifier (that needs to be identical to the sample identifier in the annotation file). R2 can perform a range of transformations (such as log2) on the data itself, thereby allowing the most flexible use of your expression data, if provided in a non-transformed fashion. The figure below shows an example for an Affymetrix array.

A number of platforms and/or normalizations not only provide a signal intensity, but can also express the likelihood that a reporter is considered expressed (like present calls or detection p-values for Affymetrix U** platforms). Such information may be provided in the matrix file by addition of an additional column (then named sample_pval). Alternatively, every sample may be provided in a separate tab delimited text document, where multiple columns can then be provided for a sample.
24.8. Preparing the gene annotation
If a platform has already been added to the R2 database, then there is no need to supply gene annotation again. If a new platform has to be added, then we require at the very least a list of all the reporters, together with their mapping to the genome (for human preferably HG18/NCBI36; for mouse preferably mm9). Furthermore, the relation between reporters and genesymbols as well as gene ids (NCBI Gene) would speed up the process of adding a new platform. In many cases, vendors of the arrays make annotation files available for download. Usually a link to such an annotation will also be sufficient. In case of doubt, please contact us by email.
24.9. Preparing the sample annotation
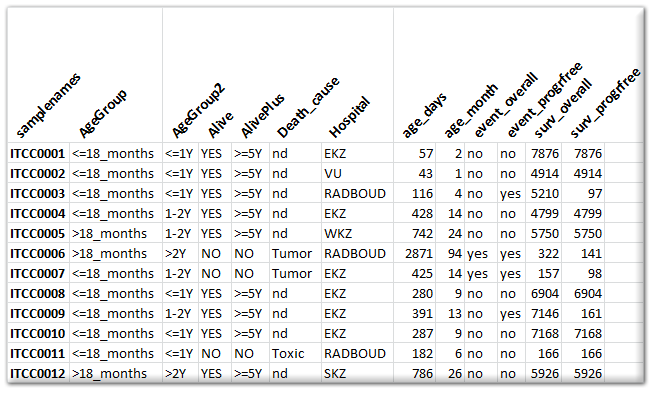
Expression data is not very useful without proper annotation. Annotation is provided in a separate tab delimited text file. Here the 1^st^ column contains the sample names and any subsequent column is treated as an annotation field (termed tracks within R2). Please refrain from using special characters within the annotation. Also, spaces in track naming should be avoided (use _ instead). An example of an annotation file can be seen in the image below. You can add as many tracks as you like / find useful. There are a number of special tracks, which you can make use of, which will now be described.
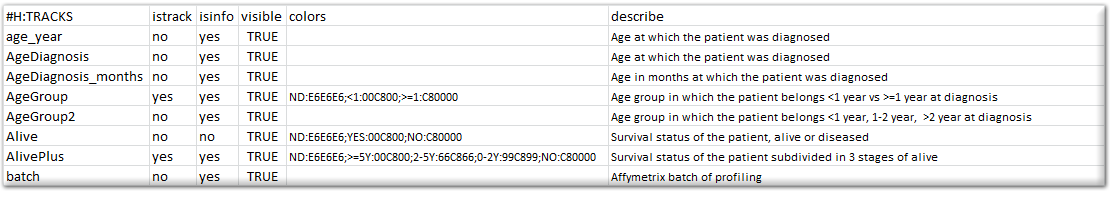
Besides providing the annotation for usage in R2, you can also specify how R2 makes use of these annotations, specifically in graphical representations. To make this known, you can prepare a “relate” file for R2. This document comprises of a number of columns that can be provided for the different tracks. Below, you can see a section of such a relate file.

Please make sure that the header of the relate file is identical to the example, and that the tracknames match to the ones that have been defined in the sample annotation. The “istrack” column tells R2 whether the annotation needs to be drawn as color coded information below YY-plots, and headers of heatmaps. The “isinfo” column defines whether the information is displayed in the table once you hover over a sample in graphs within R2. “visible” can enable/disable the use of a track. The “color” column can preset a specific color to groups which are defined within a track. These can be indicated by groupname:hexcolor. The different groups are then separated by the “;” sign. It is not required to supply this information. R2 will color groupnames automatically if such information information is not encountered. Finally, you may describe the contents of a track.
Special sample annotation
Within R2, some well-defined sample annotation labels and/or additional files, enable additional functionalities. Below, an example is described for both.
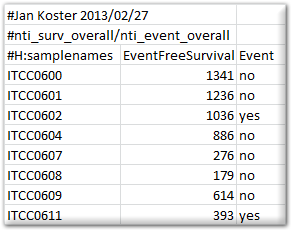
Survival information: When the dataset contains survival information, then R2 can make use of this to draw Kaplan Meier plots. To do so, R2 requires a separate tab delimited text document with a strictly defined header and some rules. Any line starting with # is considered comments, and will be excluded. There is 1 exception to this rule, which if formed by the #H: combination, which will be interpreted as a header row. A survival file should contain a header line that is identical to the example given below, as R2 will then recognize it as such. How an event is defined, may differ (overall / relapsefree etc). This can be expressed in the name of the file that is being provided. For example, the file below would be named “overall.txt”. Subsequent Kaplan curves would get the name “overall survival” on the y-axis.

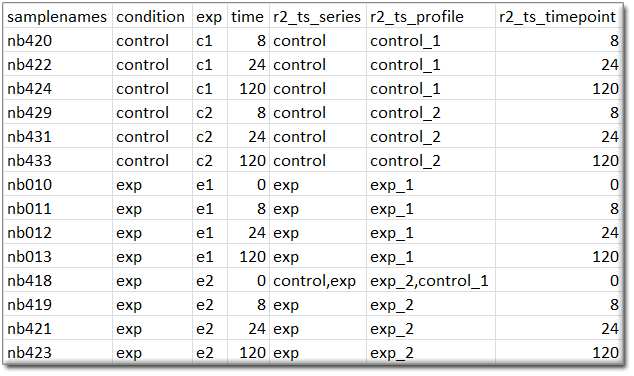
Time series graphs: When the samples are annotated with the appropriate tracks, then R2 can also present datasets as time series. When R2 encounters a column named “r2_ts_timepoint”, combined with either “r2_ts_profile” and/or “r2_ts_series”, then this will enable the option to represent the dataset as a time series (where samples/groups are connected by a line following the time variable). Profiles are intended to connect a single experiment or the following of a single subject in time. Series are intended as the grouping of profiles (for example biological replicates of an experiment), which will also create error bars on the measurements. The “r2_ts_timepoint” annotation should only contain numerical information (the time, in whatever scale you prefer (minutes / hours / days)). The other 1 or 2 annotations should provide a grouping label (which would be useful for you). In case of doubt on the usage of these annotations, do not hesitate to get in contact with us via r2-support.
24.10. Describing your dataset
Within R2, your dataset will get a name, so that you can find it back for analyses. For dataset naming the program makes use of a small number of parts (some of which can be influenced by you). For example, the department of oncogenomics has made its Neuroblastoma dataset available in R2 with the following name “Tumor Neuroblastoma public - Versteeg - 88 - MAS5.0 - u133p2”. The naming is achieved by the following parts:
1. Dataset Class. For Human datasets, one can choose from the classes defined below in italic:
- Cellline: Usually used for cell line panels, where no intervention was applied
- Disease: Datasets, where a specific disease has been investigated, other than cancer
- Exp: Experiment datasets. Usually cell line models in which interventions have been applied (Gene transfection, rna interference etc)
- Mixed: If a dataset makes used of multiple items, then it becomes a mixed set
- Normal: The profiling of healthy normal material
- Tumor: Datasets which are composed of a specific tumor type belong in this category
2. Tissue. Depending a little on the choice of class, usually a description of the tissue / tumor is given in the second part. In the example, this was “Neuroblastoma”, but this could also be “Breast” or “Colon” if such a dataset was described. For experiments, the tissue or tumor type is also often described, to make sure that datasets with the same theme are close together. If we would describe the shRNA knockdown of the MYCN gene in the neuroblastoma cell line IMR32 for example, then this would become “Exp Neuroblastoma IMR32 MYCN shRNA”.
3. Author. Finally, you can supply the author / consortium in naming your dataset. This should be self-explanatory.
R2 will add the number of samples within the dataset, a normalization scheme and finally also a code representing the platform which has been used. If you are supplying a dataset other than Affymetrix gene expression arrays (Exon or U***), then you should provide us with the normalization, and platform used as well. The platform, doesn”t have to be the code that R2 uses, but can also be described by the manufacturer and the array ID.
Optionally, you can also describe your dataset in more detail in the following fields (which are also shown if you click on the “i” image next to a dataset). Title: 1 line description of your dataset. Summary: free text option to describe your dataset in as much detail as you wish (See also GEO for examples). Design: free text describing the design of your dataset (See also GEO for examples).
We hope that this document has been helpful in preparing your dataset for inclusion in R2,
R2 support (r2-support@amc.uva.nl).