10. Multiple datasets overview with Megasampler
Create an overview of the expression level of genes in multiple datasets
10.1. Scope
- The megasampler is a R2 module to investigate the expression level of a gene in any number of the numerous datasets stored in the R2 database
- Use R2 to compose your selection of datasets to investigate the expression level of a gene
- Use the megasampler “adjustable settings” to adapt the megasampler graphics
- The megasampler allows you to quickly get an overview of the selected gene expression level for all the datasets available in the R2 database
- Go directy from the overview to one-gene view to investigate in detail the expression level in a single dataset.
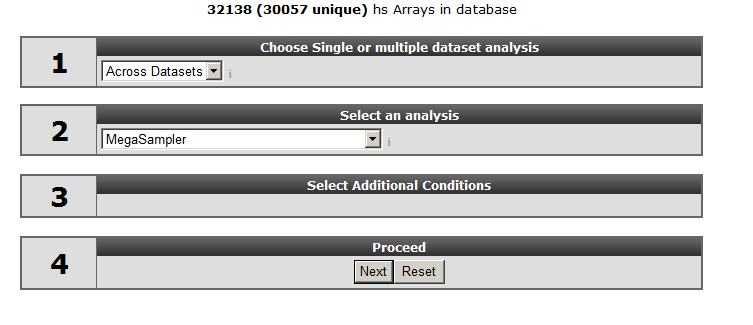
10.2. Step 1: Selecting multiple datasets
Select “Across Datasets” in field 1, by default the “megasampler” option will be selected in field 2 and click “next”.

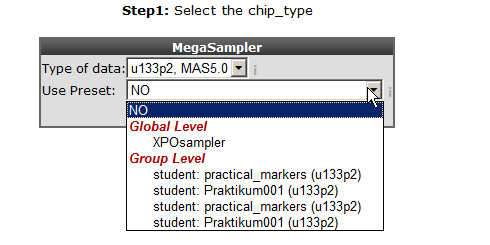
Leave “u133p2, mas5.0” at the “type of data” option and select “ XPO sampler” at “use presets”. The meaning of presets will be explained later on.
![]() Did you know that R2 harbours different types of microarray platforms
Did you know that R2 harbours different types of microarray platforms
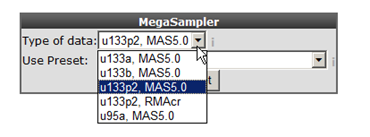
Megasampler only allows you to query multiple datasets if they are of the same chiptype and normalized by the same algorithm.
With the “selection preset” option a pre-stored dataset collection with associated settings can be selected. Select “XPO sampler” (Expression Project for Oncology (expO)) to pre-select a series of tumor datasets. Click “next”.

In the previous screen the preset “XPOsampler” is selected, a collection of datasets is already marked for the megasampler analyses. In Figure 3 clicking the small triangle unfolds the available dataset categories, notice that some of the datasets in the “tumor” section are already marked. In this way this you can adapt your pre-selection of datasets. Unfold the normal and tumor category and select the following datasets. Normal Adrenal gland - Various “ 13, Normal Brain PFC - Harris “ 44 and the “ Tumor Neuroblastoma public - Versteeg “ 88” . Enter MYCN and click “next”.

![]() Did you know that private datasets linked to a specific user are indicated with a green background color
Did you know that private datasets linked to a specific user are indicated with a green background color
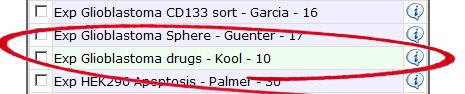
Add a private dataset to the (pre) selected datasets.
10.3. Step 2: Viewing a gene in multiple datasets
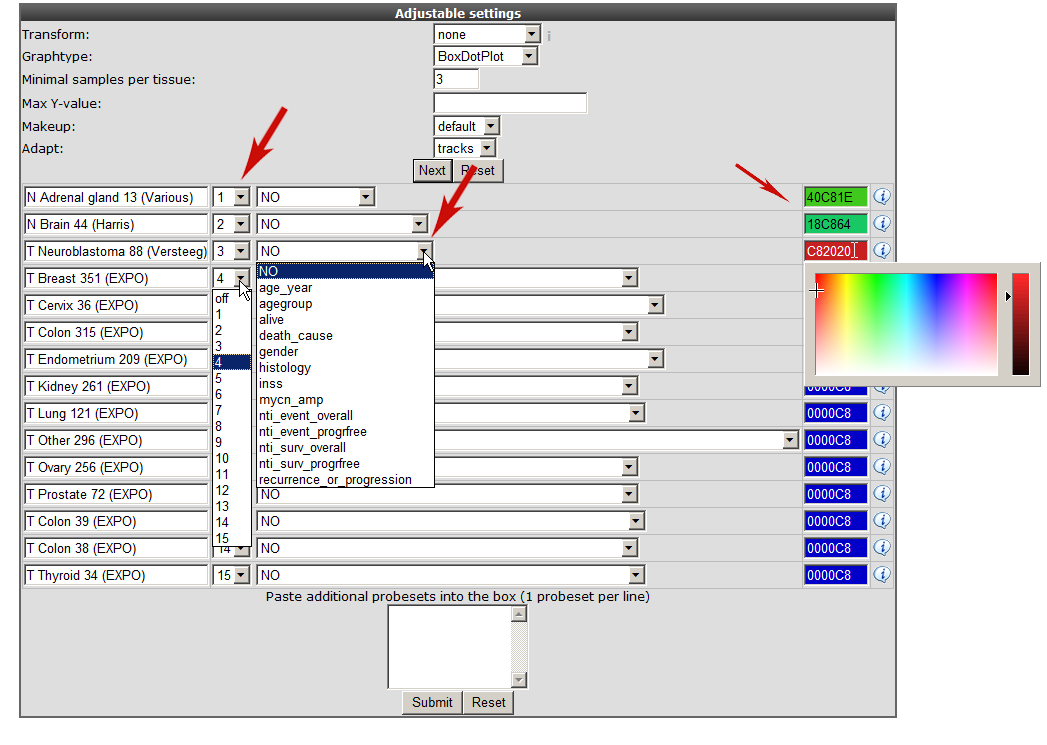
In the “adjustable settings” panel there are several options to customize the megasampler graph. For every selected dataset, you can change the order in which they are drawn by adjusting the number in the selection boxes. These are processed first, followed by the dataset names in alphabetical order (so changing the order of 1 or 2 datasets should be sufficient). The pull down next to “dataset ordering pull down menu” enables to split one or more dataset by selecting a track , in this way the chosen dataset(s) will be split according to the numbers of groups of the selected track.
For now change the color for the datasets as indicated in Figure 4 and click “next”.
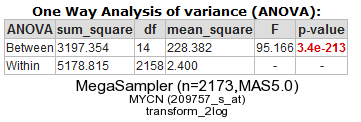
R2 now performs a one-way Anova statistical test on the fly. This ANalyis Of VAriance is a statistical test that calculates whether the means of the expression levels between the selected datasets are significantly different.
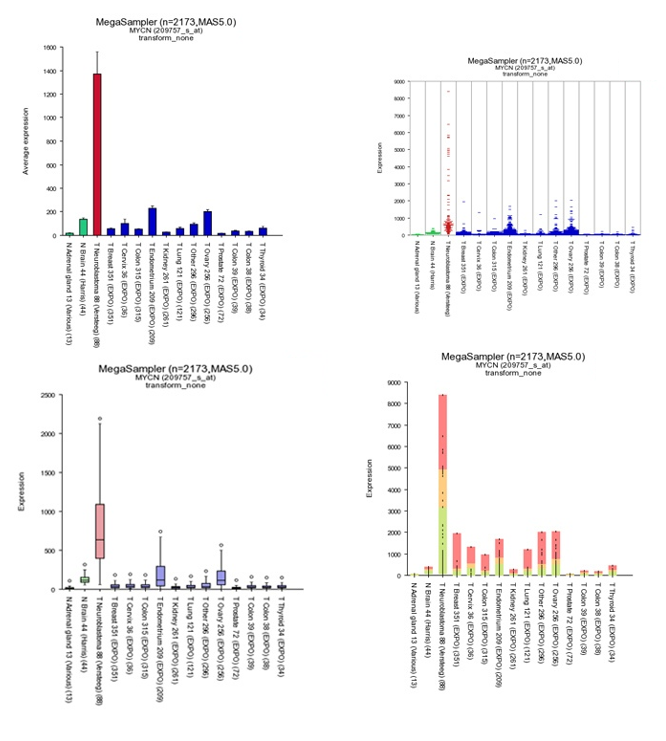
By default de megasampler graph is plotted in a so called Boxdotplot representation. The Boxdotplot shows a combined boxplot, on top of which the signals of the separate samples are plotted; a quickly interpretable graph.
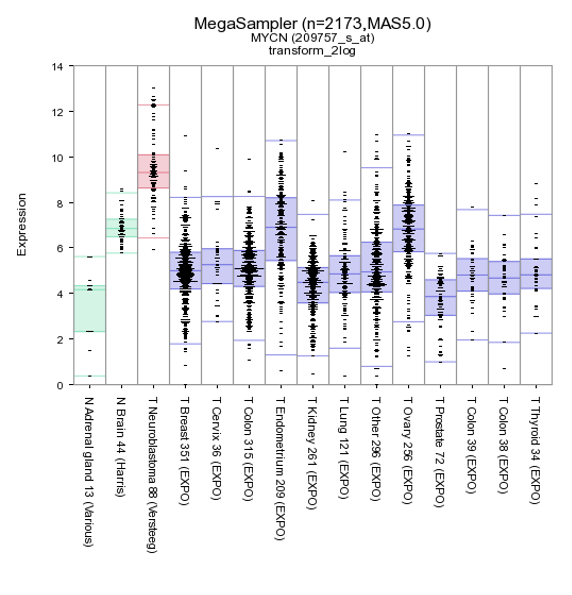
Figure 6: MYCN expression levels in 15 datasets covering 2173 samples.
Additional insight can be obtained transforming the data, in this case transform the data to logical values (none) set “graphtype” on barplot and click on “redraw at the bottom of the screen.

Figure 7: Different Megasampler graphical representations
The plotted graphs for “MYCN” clearly show a high expression level specifically in the Neuroblastoma data sets compared to Normal Tissue and other Tumor datasets. At the bottom of the page it’s possible to adapt dataset coloring, change the order and split datasets in tracks directly.
![]() Did you know that you can save your selection of datasets and select your stored dataset the next time you login to R2.
Did you know that you can save your selection of datasets and select your stored dataset the next time you login to R2.
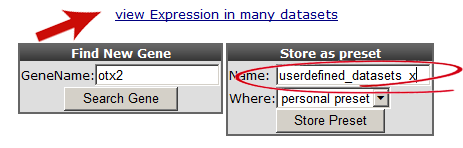

Storing a preset not only stores the selection of datasets for future use, but will also keep all of the other settings such as order, colors, plot type etc. The same visual representation for any other gene can be generated in this way.
You can can use the adjustable panel to adapt the megasampler graph. In case you split one or more datasets according to a specific track in the previous screen, it’s now possible to skip subgroups from your dataset or, more interestingly, apply different colors for groups within a dataset (see Figure 8).
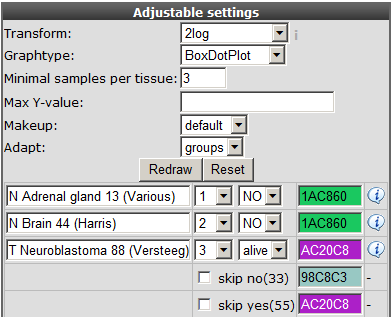
Figure 8: Adjustable settings panel, color groups within adataset.
10.4. Step 3: Expression distribution over many datasets
The red arrow in the “did you know box” brings you to a handy module to obtain a quick overview of the expression level patterns for most of the datasets R2 contains (providing that the normalization allows comparison).
Click “view Expression in many datasets” and a new screen (or tab) appears containing a Probeset distribution graph. The color of the dots represent the different dataset categories (cell line dataset, Tumor or Normal Tissue etcetera). Via this 2D distribution module you can easily detect in what way your probeset of interest is expressed in many other datasets. At the Y-axis the 2log transformed average expression level and the standard deviation is represented. The X-axis “overlap avoider” is simply a way to represent all datasets in the plot without overlap of the circles. Figure 9 clearly shows that the MYCN expression is also high in other dataset which could be of interest and a second Neuroblastoma dataset. Next to the graph 2 tables summarize dataset names and a R-value set to “1. This has no specific meaning in this context but comes of use with the 2D-distrubution module where you can quickly scan the correlation between two genes for all datasets of the same platform in R2. This module is discussed in the Correlate Genes tutorial.
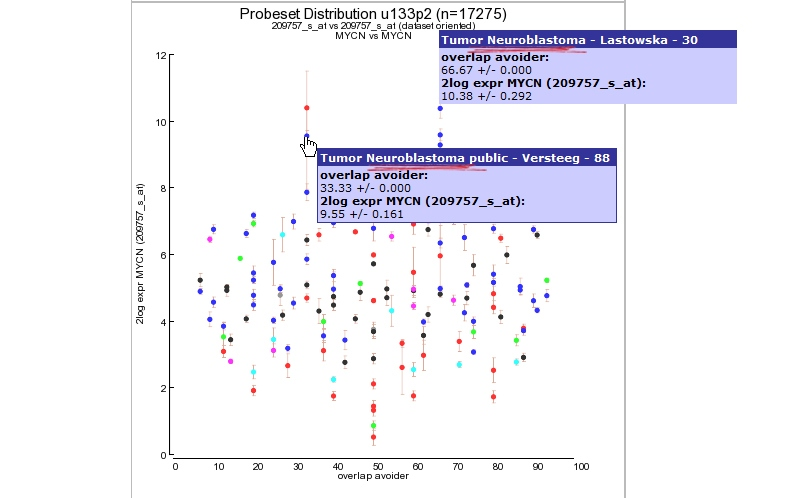
Figure 9: MYCN expression level distribution for all u133-2 datasets in R2.
Via the the probeset distribution view you can easily investigate a specific dataset in more detail. Click a preferred colored dataset dot and R2 will generate an one-gene-view graph. The one-gene-view representation is explained in more details in tutorial 2.
10.5. Step 4: Megasearch
We have already discussed the ‘find differential expression’ module for a single dataset to find differentially expressed genes. In the across dataset section we can also apply a similar approach, not between groups within single dataset but for a user defined selection of multiple datasets. However, keep in mind that you can only select datasets of the same platform, the most abundant datasets are of the Affymetrix u133p2 platform. As explained before not every platform can be used for the megasearch due to the normalisation procedure which has been used.
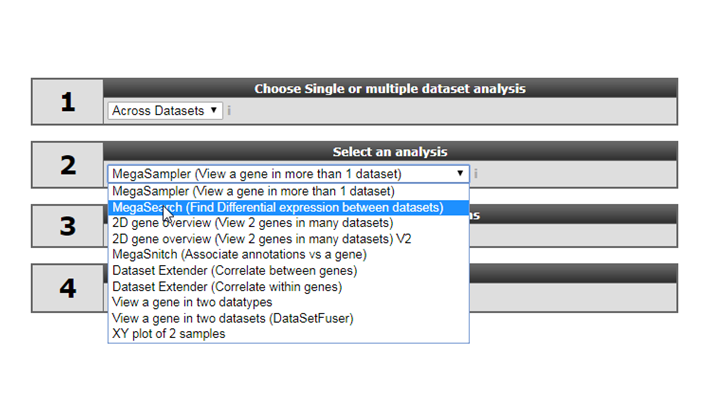
Figure 10: MYCN expression level distribution for all u133-2 datasets in R2.
- Select ‘Megasearch’ in Box 2 and click next
- At step 1 select the platform you want to use, for now select the default (u133p2).
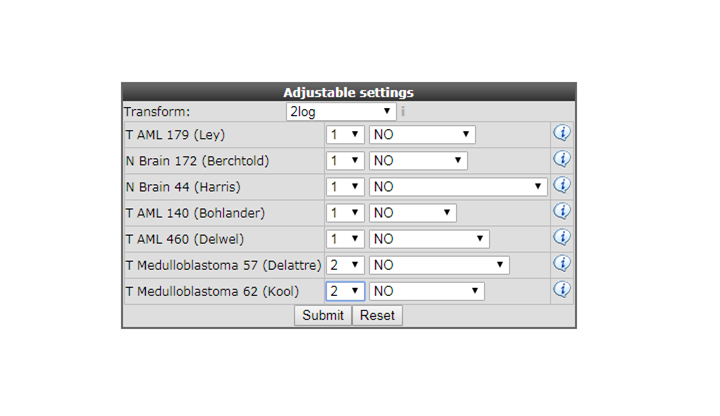
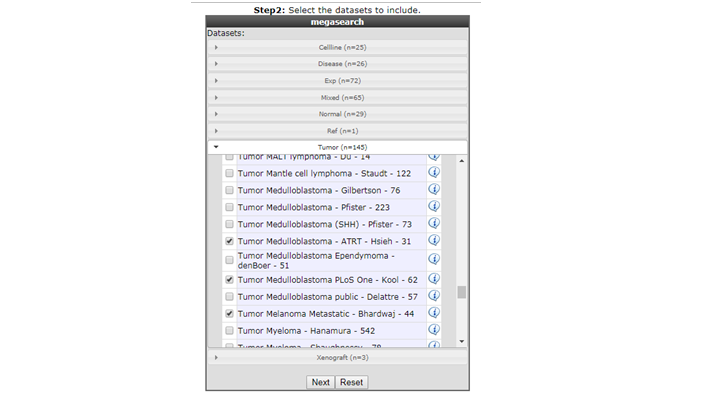
- Select the datasets you want to use for the analyses, in this example we have selected Normal Brain , AML and Medulloblastoma datasets, click next.
- For the megasearch module only two groups can be used to find the statistical differently expressed genes. In the settings box assign the proper grouping parameters (1 or 2) leave the pulldown menu at the default setting (’NO’) for the datasets and click next.
Figure 12: Assign the statistical group for testing
- In the next adjustable settings menu select at Genecategory ‘transcription regulator Act’ for gene filtering. In the ‘Hugoonce Dataset’ pulldown menu the first selected dataset will be used as target dataset for probeset usage.
For most platforms each gene has multiple probesets, when using this option R2 takes the probeset with the highest average signal. For the megasearch you can not use for
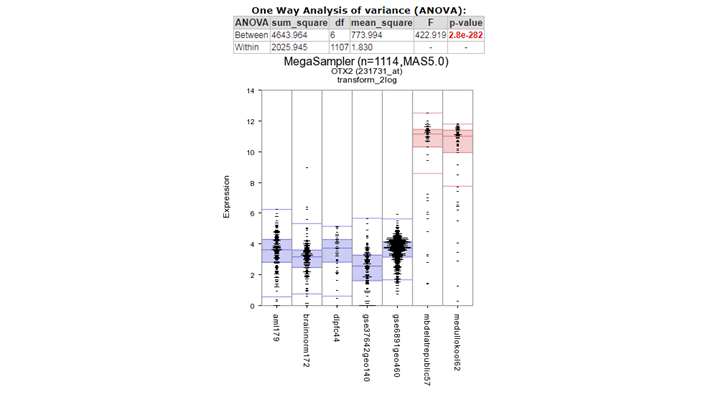
each dataset a different probeset for a particular gene. In the ‘Hugooce Dataset’ pulldown menu you can change the target dataset in case you already familar with one of the selected datasets to make sure that probesets from single datasets analysis are used. In case of OTX2 which is a marker gene for Medulloblastoma two probesets are designed (242128_at and 231731_at) in the most
Medulloblastoma datasets depending of the subgroups 242128_at has the highest expression level and will be picked by R2 however in other type of cancers/tissues there is hardly any expression of the OTX2 gene and in that case the other probeset could easily be selected.
At the statictics pulldown menu you can select fdr_modarate_t_statistics (Limma ,
Limma-git)
or the standard uncorrected_t_test. The Limma algorithm is specifically designed for the analysis of gene expression data , leave the statistics at moderate_t_statistics and click next.
Two tables of genes are generated with the highest significantly expressed genes for group 1 and group 2. In the left genelist (group 2) we find in the top 10 ,
the OTX2 gene which is accociated with medulloblastoma.
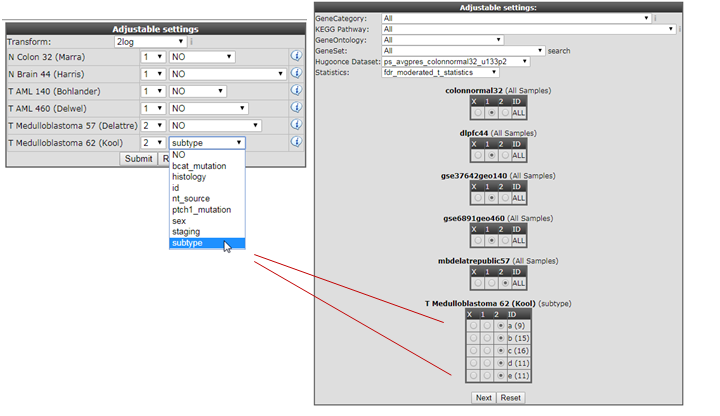
- In the previous Adjustable settings box, where the grouping parameters were assigned, you can also split datasets based on their subgoups (tracks) and incorparate the subgroups in different test groups as illustrated in Figure 14.

Figure 14: Assign the statistical subgroup for testing
![]() Did you know that the Megasampler can also be used to investigate through the methylation datasets
Did you know that the Megasampler can also be used to investigate through the methylation datasets
10.6. Final remarks / future directions
We hope that this tutorial has been helpful, the R2 support team.