2. Using Datasets
Selecting or searching datasets in R2
2.1. Scope
Working with datasets.
R2 allows you to perform all kinds of analyses based on a well annotated single dataset or a selection of datasets at the same time. Different analyses are available based on the selection of one of these options in field 1.
R2 contains omic profiles such as expression and methylation profiles for more than 1.200.000 unique individual samples. The samples are grouped in so-called datasets. Each dataset has its own characteristics, such as tissue type, tumor/disease type, or from cell-line experiments. Frequently, new datasets are added the platform.
The Tumor Neuroblastoma public - Versteeg - 88 - MAS5.0 - u133p2 dataset will be used as an example dataset to guide you through most of the tutorial. Later on, working with multiple datasets will be discussed.
2.2. Step 1: Selecting a dataset
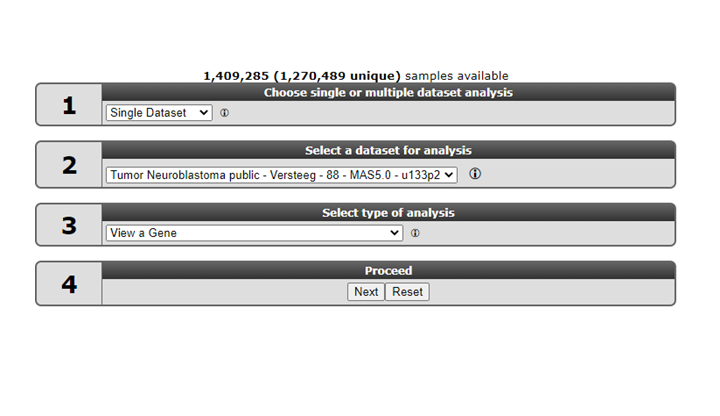
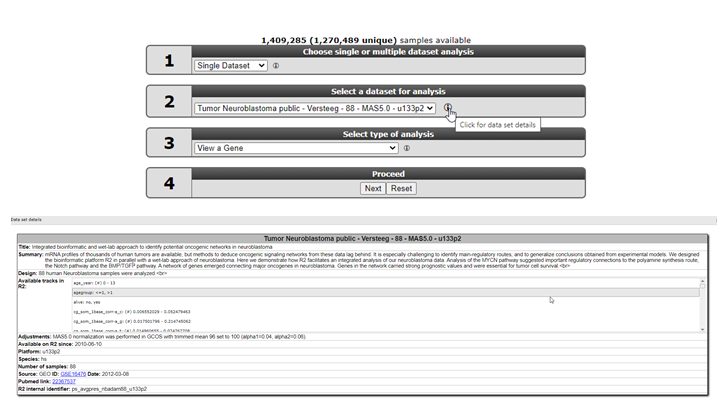
R2 offers a large number of readily available datasets for analysis and visualization. The numbered boxes on the main page will guide you through all the steps necessary to perform a task, starting with the selection of a dataset. In box 1 select Single Dataset, in field 2 click on the name of the dataset.
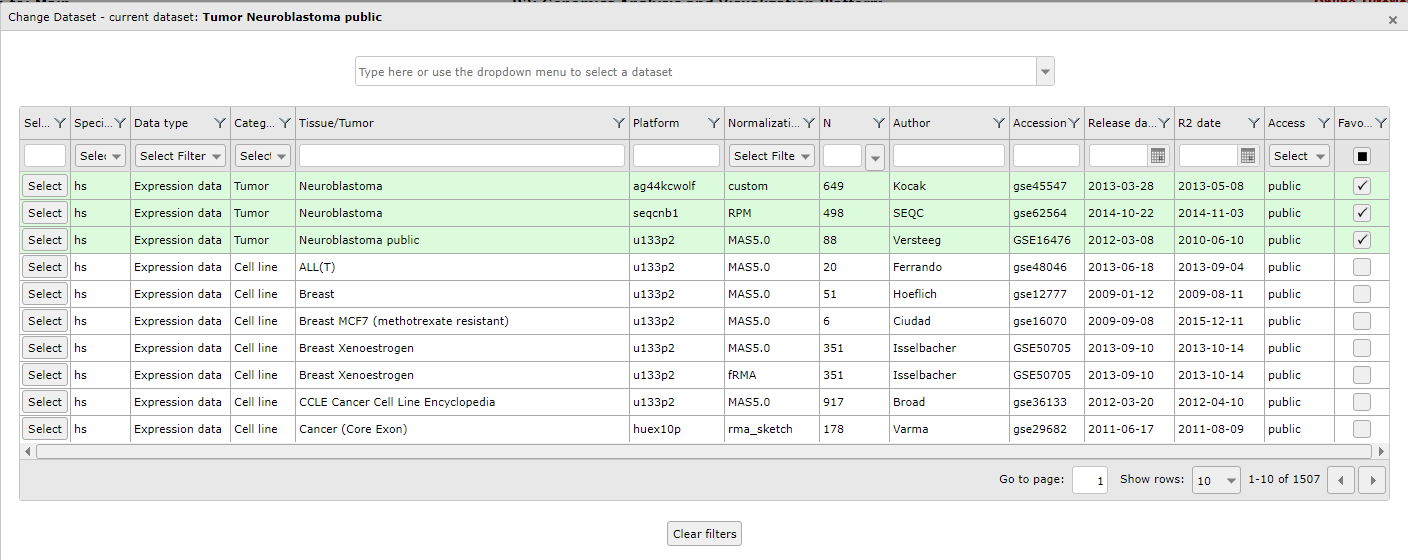
A popup window appears that shows all the available datasets in a grid: each row represents one dataset, with its main descriptive details split up in the columns. To use a dataset for further analysis, you click on the Select button in the first column.If you prefer to first read extra information about the dataset of your interest, click on any other part of the specific row (dashed area).

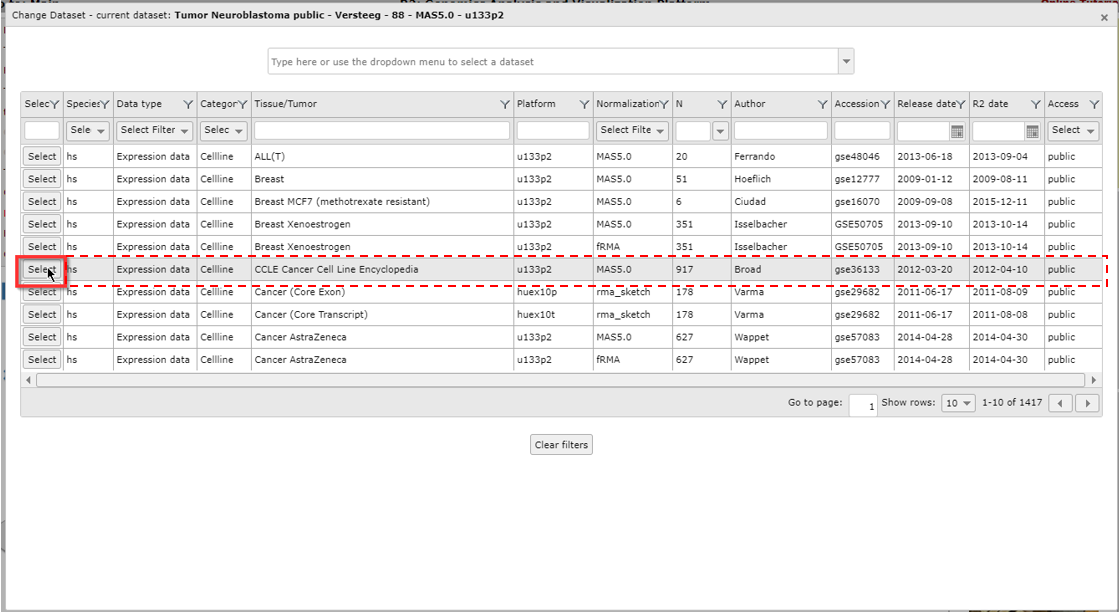
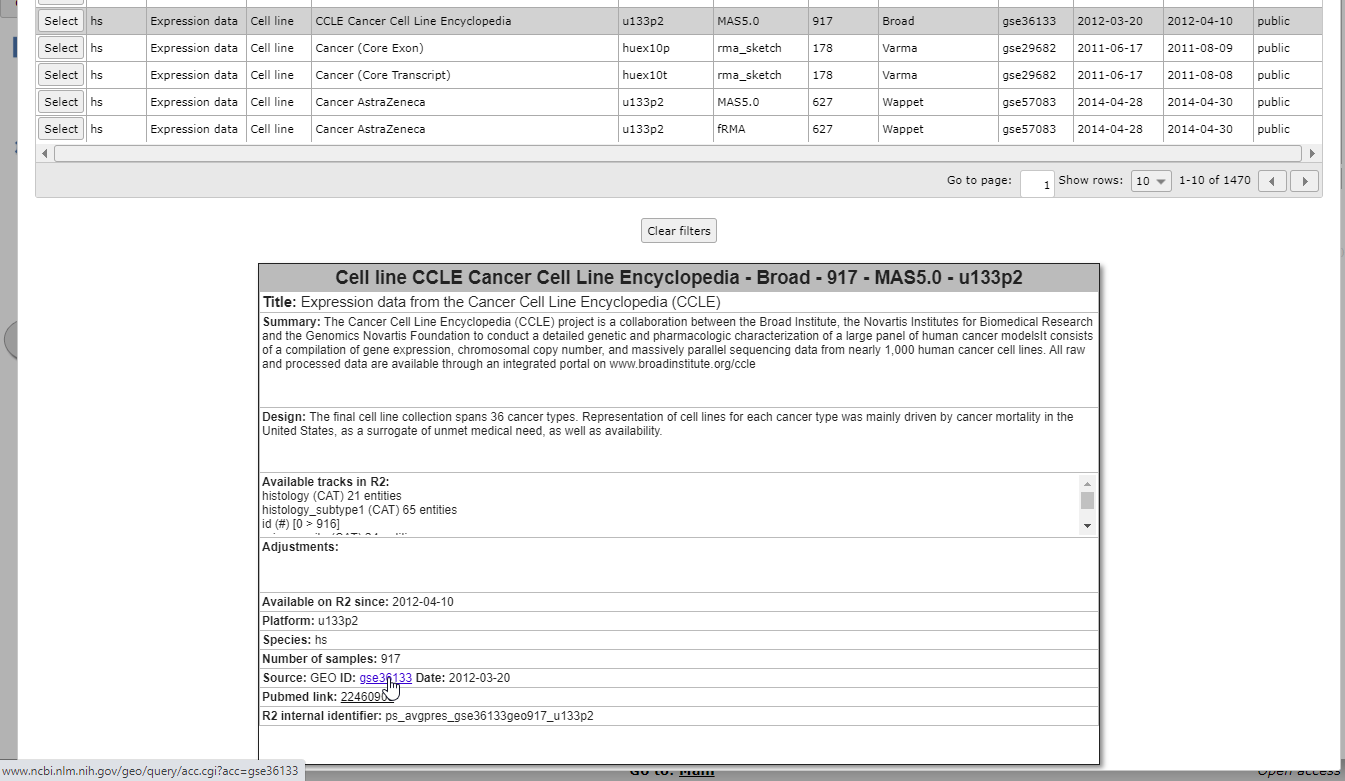
When you click on any of the information cells of the dataset row (dashed area), an information panel below the grid shows background information about the data. Possible adjustments of the original data by the R2 team, such as data transformations or annotation changes, can be found in the Adjustments box of the information panel. At the bottom you will see links to the original data source and Pubmed resources, if available.

Figure 3B: Read in-depth information about a dataset
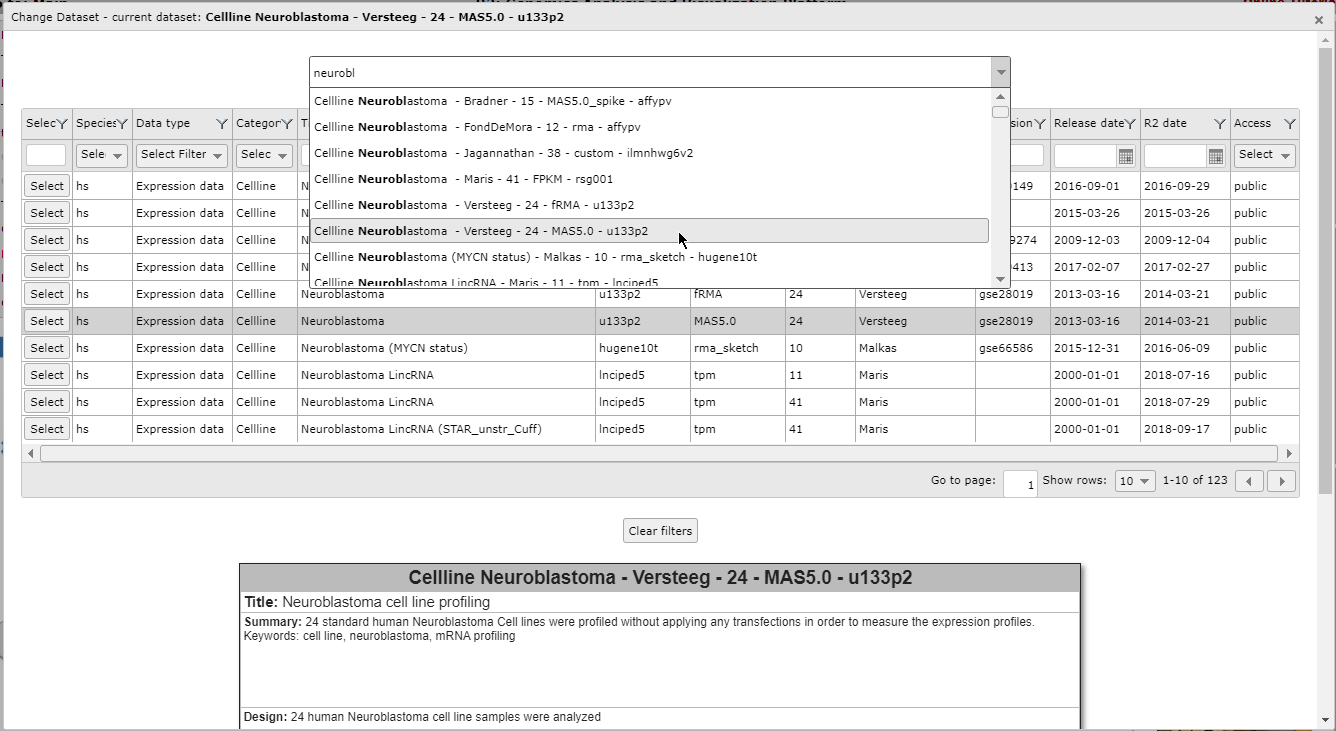
A search bar is located on top of the page. It allows you to search a dataset by (a part of) a keyword, such as a tissue type, a disease, or an author name. When you start typing in the search bar, a list appears with datasets that correspond to your keyword. Also, the grid is adjusted to only show the datasets that fulfill your search requirement.

Figure 4: Use the search bar to textually filter the list of datasets with a keyword
You can simply scroll through the list with the mouse and get more information about a dataset with a click of the mouse on any dataset in this list.This way you can quickly filter for a tissue type, a disease or an author name. In the picture above we type the letters “neurobl” to look for all Neuroblatoma datasets.
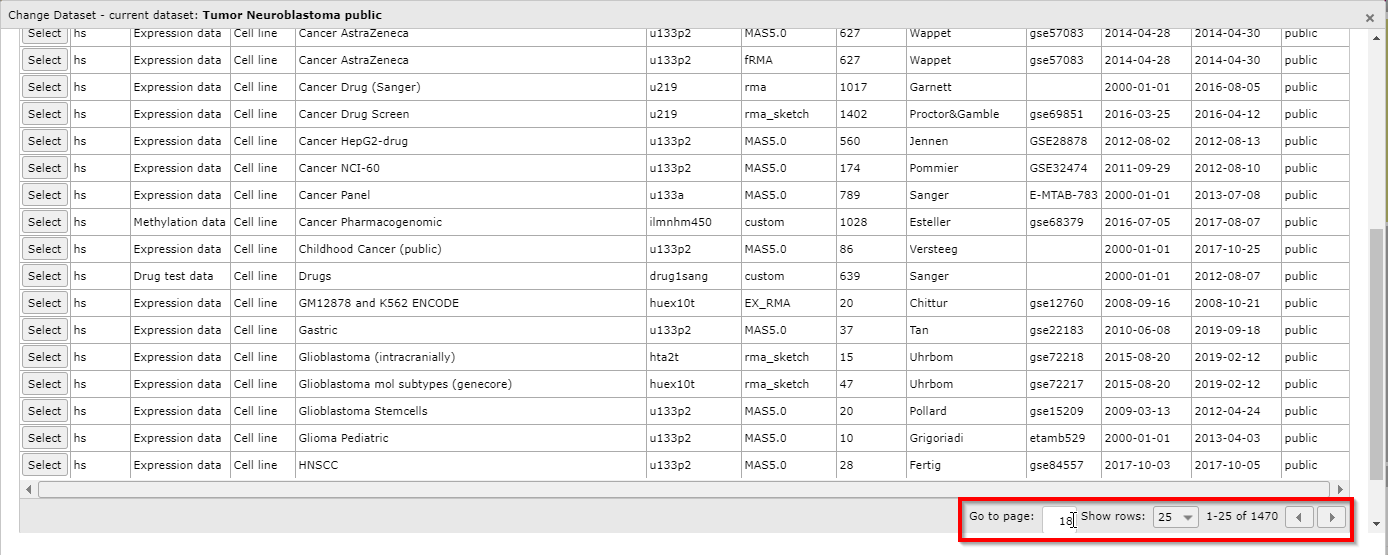
You can use the buttons in the bottom right corner to scroll through the pages of the grid, to jump ahead to a specific page and to adapt the amount of dataset rows that are shown per page.
Click on the ‘Select’ button in the grid to see the dataset of your choice appear on the main page in box 2 for further analysis.
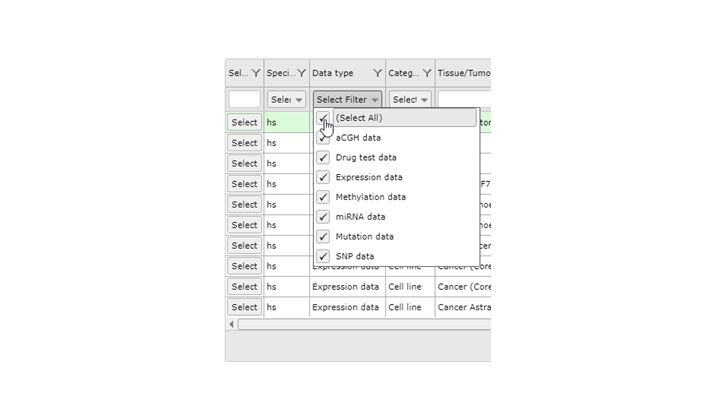
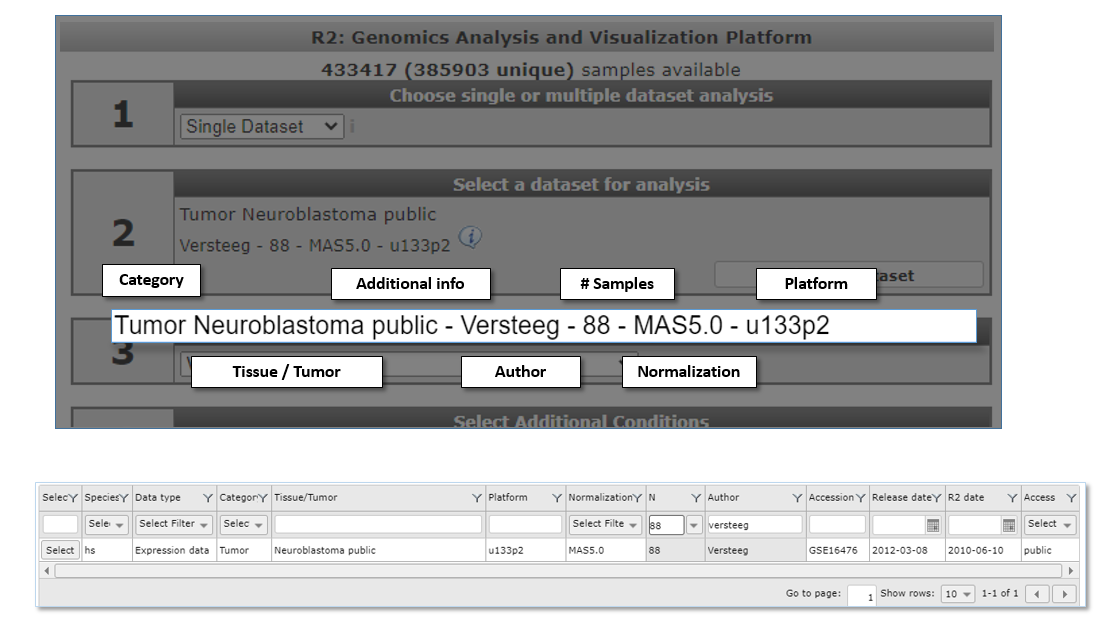
![]() Did you know that datasets have an informative naming? Datasets have a structured naming in R2, using the following rules: type_of_dataset - author - number_of_samples - normalization - chiptype. The dataset selection grid consists of these informative parts as columns, each with filter options to perform an advanced search through the dataset.
Did you know that datasets have an informative naming? Datasets have a structured naming in R2, using the following rules: type_of_dataset - author - number_of_samples - normalization - chiptype. The dataset selection grid consists of these informative parts as columns, each with filter options to perform an advanced search through the dataset.

2.3. Step 2: Advanced selection of datasets
The grid itself enables the user to search through datasets using keywords and other filter options as well. The column dropdown functions and textboxes can filter the datasets for specific characteristics, e.g. datasets with a minimal number of samples, or a specific author, platform or publication date. You can easily combine the search functions of the different columns.
As an example, we want to see which large neuroblastoma sets are available. First we write part of the word neuroblastoma in the search box of the Tissue/Tumor column. Next, we use the pull down of the N (sample number) column to order the datasets in descending order.
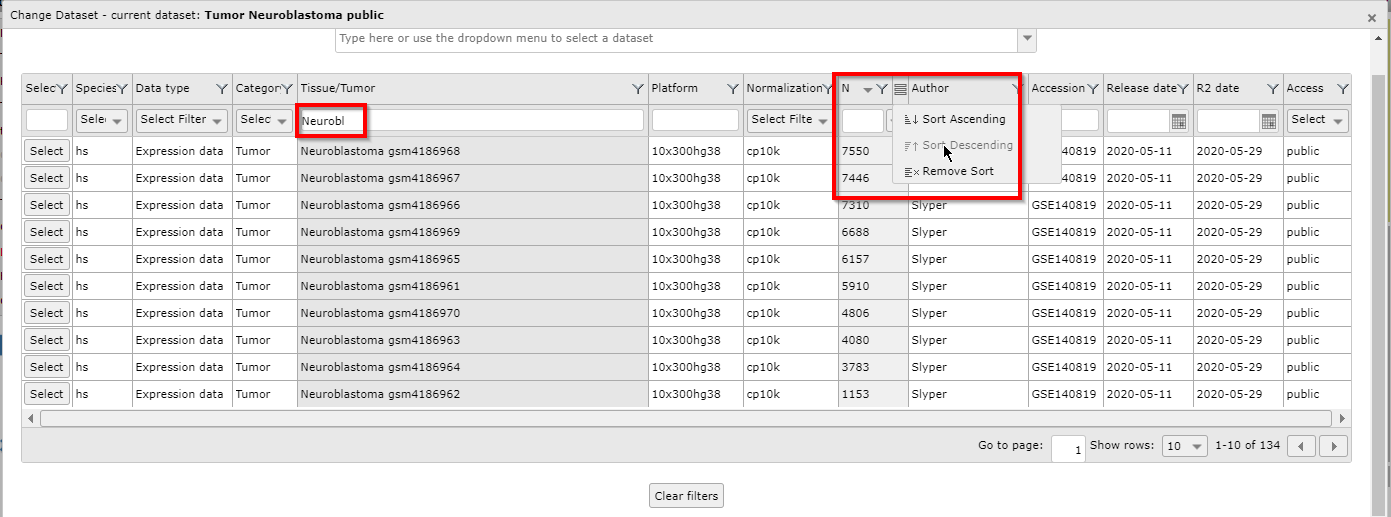
Again we use the Select button if we want to continue our analysis with a specific dataset of the grid.
Select “Across Datasets” in field 1. Note that in field 2 different options become available compared to the “single dataset” option.
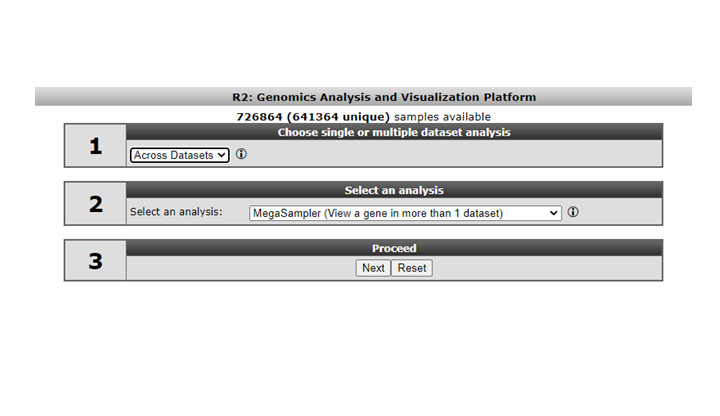
Figure 8: Selecting across datasets
Analysis methods following selecting the “Across Datasets” option in field 1 will be discussed in tutorial “Working with multiple datasets”.
![]() Did you know that clicking on an exclamation balloon provides additional info?
Did you know that clicking on an exclamation balloon provides additional info?
2.4. Step 3: Using Dataset favorites
Since R2 is hosting hundreds of datasets, it could be convenient to store the datasets you often use in a preselection that is easily accessible. In order to maintain favorites, you need to be a registered user. If you did not yet register; accounts can easily be created via ‘Login/Register’ and are absolutely free. Clicking on ‘Change Dataset’ will open the datasets page, where resources can be searched and selected.
Figure 9: Change Dataset to access favorites
Within the dataset selection table, you can select and deselect cohorts to add or remove them from your selection of preferred sets. This is done by using the favorite select boxes in the last column on the right side. Favorite datasets will always be represented at the top of your selection table and will be marked with a green background color. This makes it very convenient to quickly have access to those.
2.5. Step 4: Data Scopes
- R2 can be forced to only display a sub-selection of all the datasets that are available (e.g. only neuroblastoma datasets). These are called data scopes and can be selected from within R2 by the left-hand menu item ‘Change Data Scope’. From here you can use one of the preset scopes. This is also the section where you can remove a scope that has been set. An obvious reason why scopes can be convenient, is the focussed view on the available data: to restrict data to a particular subject or as a landing page for a specific publication/subject. Datascopes as dedicated landing pages can also be configured to expose additional functionalities and quick jumps to sections in the platform. Just have a look at which ones are accessible given your access rights.
- Data scopes can be used directly from the internet address line, which can be handy when a referral needs to be made to R2 from a manuscript. For now, you do need to provide a link directly to the server (usually hgserver1.amc.nl/cgi-bin/r2/main.cgi?&dscope=NRBL).
Further details on the use of Datascopes can be found in the tutorial Datascopes.
![]() Did you know that the R2-support team is scanning public repositories for interesting datasets to expand the R2-database on a regular basis
Did you know that the R2-support team is scanning public repositories for interesting datasets to expand the R2-database on a regular basis
In case you want to see a dataset added to R2 please send an email to r2-support@amsterdamumc.nlSuch an email should contain a link to the publicly accessible files, such as a Gene Expression Omnibus number (GSE*****).
Your own private datasets can also be added to R2 with user/group restricted access. Please send us an email at r2-support@amsterdamumc.nl and inquire on the procedure to get your data available in R2 (see also Chapter 22).
2.6. Final remarks / future directions
Everything described in this chapter can be performed in the R2: genomics analysis and visualization platform (http://r2platform.com / http://r2.amc.nl)
If you run into any quirks or annoyances do not hesitate to contact r2 support (r2-support@amc.uva.nl).
We hope that this tutorial has been helpful, the R2 support team.